Every company today collects more data than it can read. Sales numbers sit in one system, customer records in another, and marketing results in a third. Without a way to bring it all together, that data becomes noise rather than value.
This guide shows you how to change that. You will learn what business intelligence means, how it works step by step, how it compares with analytics and artificial intelligence, the benefits it brings, the tools worth knowing, 10 real examples, and how to start using it in your own company.
What Is Business Intelligence (BI)?
Business intelligence is a technology-driven process for collecting, storing, analyzing, and presenting business data. It helps organizations understand what happened, why it happened, and what to do next, using dashboards, reports, and visual summaries anyone can read.
BI is not a single product. It combines several practices into one system:
Analytics: examining data to find patterns and trends.
Data mining: searching large datasets for hidden relationships.
Data visualization: turning numbers into charts and graphs.
Dashboards: live screens that track key metrics in one place.
Data infrastructure: the databases and pipelines that keep information clean and available.
The core problem BI solves is simple. Instead of asking "What do we think is happening?", teams can ask "What does the data show?" and get a reliable answer in minutes.
A Brief History of Business Intelligence
The term goes back further than most people expect. In 1958, IBM researcher Hans Peter Luhn used "business intelligence" in a paper describing a system that would route information to the right people. In 1989, Gartner analyst Howard Dresner popularized the term as an umbrella for methods that support decisions with facts.
For decades, BI belonged to IT departments. Analysts built reports and managers waited days to see them. Today, self-service BI tools let any employee build a dashboard or ask a question of the data without writing code.
Key Components of a BI System
Data integration (ETL): Extract, transform, load. Pulls data from many sources, cleans it, and formats it consistently.
Data warehouse: A central store, often in the cloud, that holds structured data ready for analysis.
Data visualization and dashboards: Charts, maps, and scorecards that make trends visible at a glance.
Reporting tools: Scheduled or on-demand reports for teams and executives.
Self-service analytics layer: Simple interfaces that let non-technical users explore data on their own.
How Does Business Intelligence Work?
Business intelligence follows a clear sequence, moving from raw data to real business action:
Data sources: Start by deciding which data you need to review. It can come from central data stores, cloud platforms, inventory and pricing records, sales and marketing results, customer management systems, supply chain records, industry figures, or social media channels.
Data collection: Bring the data together and clean it so it is accurate and consistent. Small teams may do this by hand in a spreadsheet, while larger companies use automated extract, transform, and load (ETL) processes. Platforms like Infobrim connect systems such as ERP, POS, CRM, HR, and finance in one place, giving every team a single, real-time source of truth.
Analysis: Search the data for trends, patterns, and surprising results. Common methods include data mining, data discovery, and data modeling, which reveal what happened and why.
Visualization: Turn the findings into charts, graphs, and dashboards that anyone can read at a glance. The best dashboards let users drill down into details, drill up to the big picture, and drill through to related data. With Infobrim’s real-time visualization, teams can explore live dashboards and ask questions in English or Arabic.
Action plan: Compare historical results against your key performance indicators (KPIs) to build clear, practical next steps. These may include streamlining processes, adjusting marketing campaigns, solving supply chain problems, or improving the customer experience.
Analytics in Business: BI vs. Predictive and Advanced Analytics
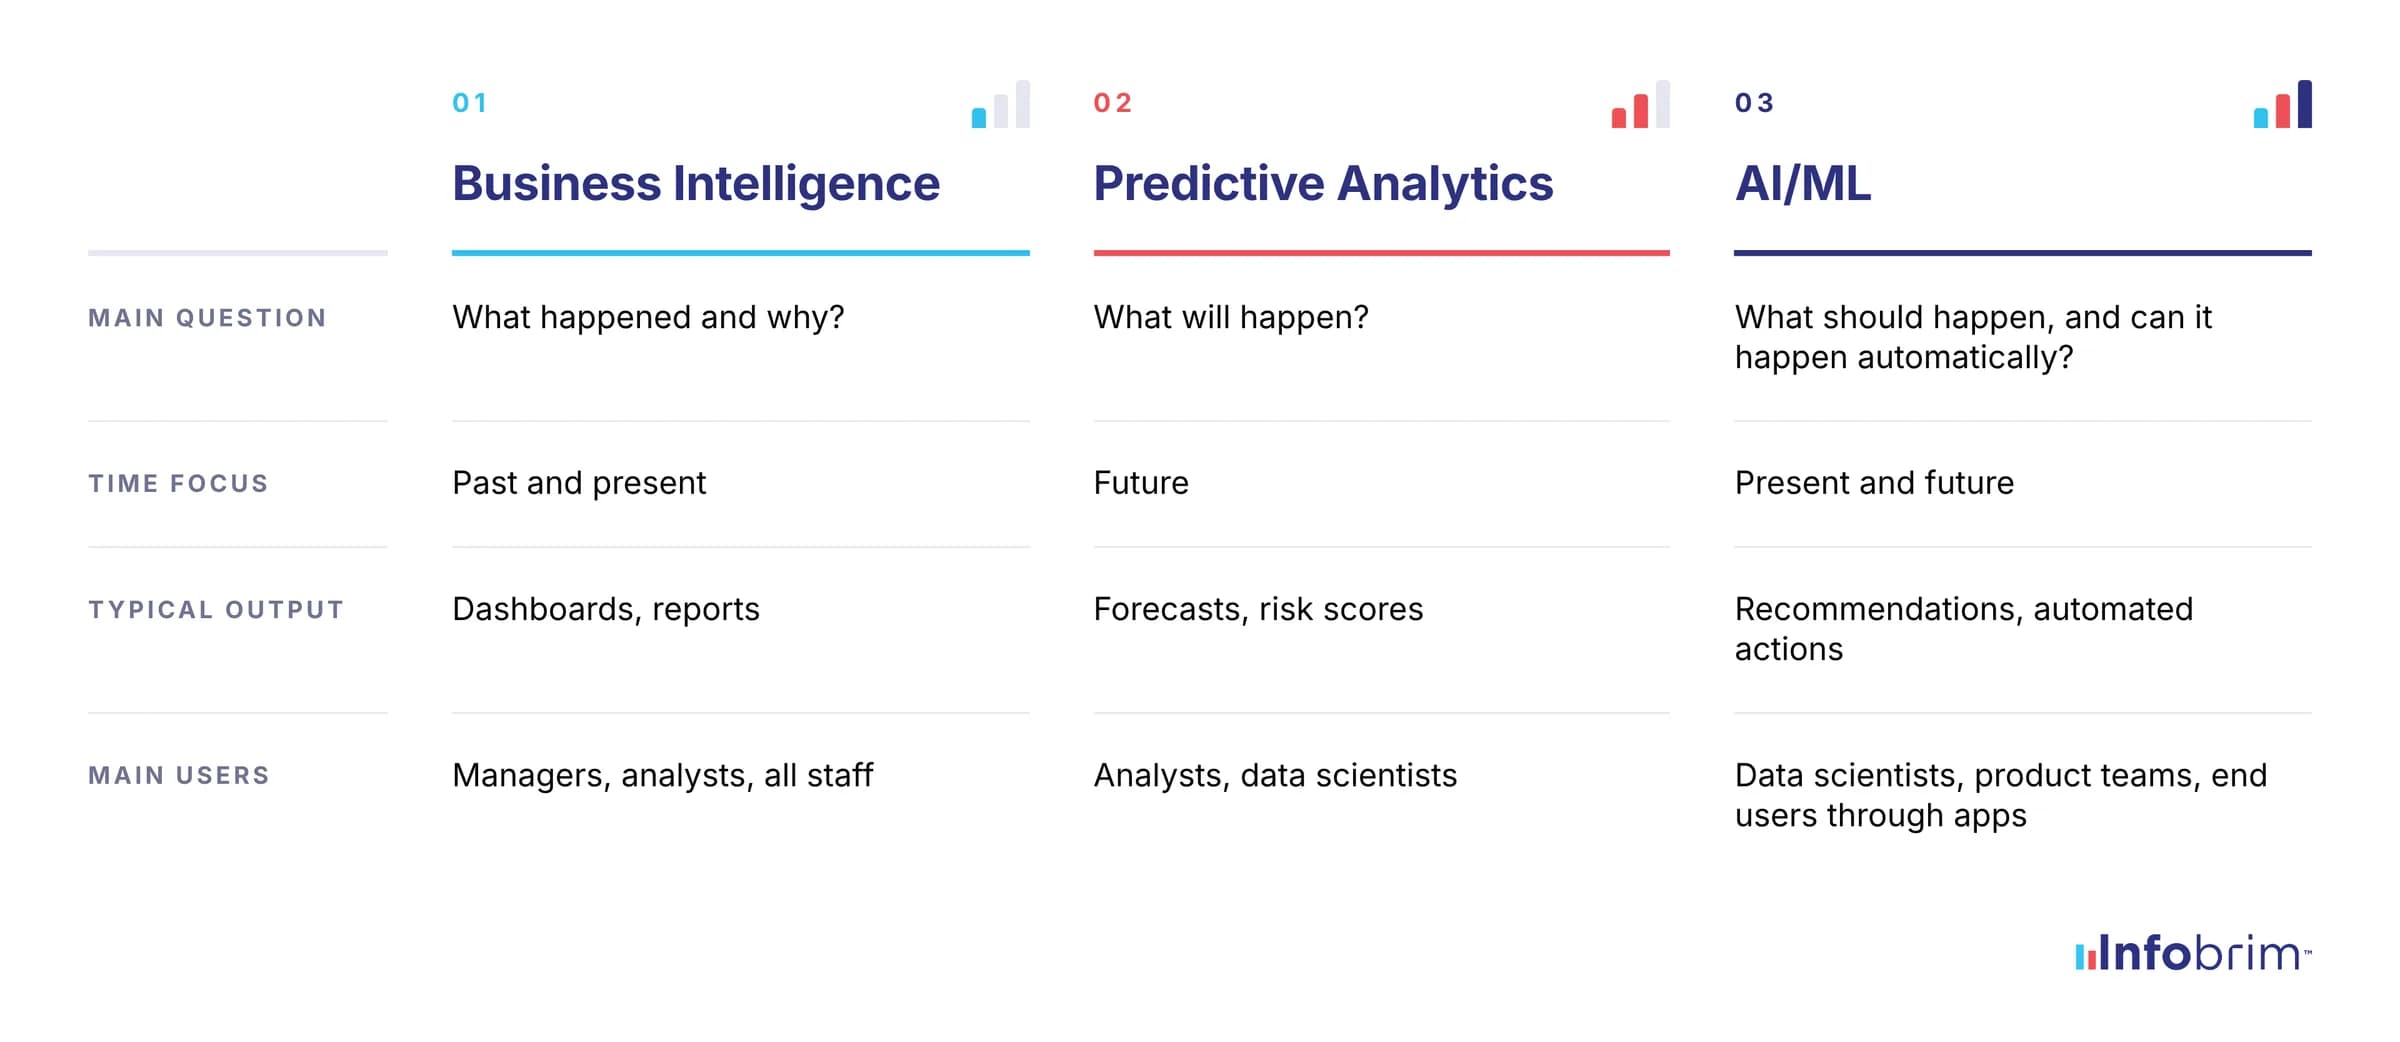
Analytics in business is the practice of using data to answer questions and guide decisions. It covers four levels, each one more forward-looking than the last:
Descriptive analytics: What happened? (Last quarter's revenue by region.)
Diagnostic analytics: Why did it happen? (Revenue fell because one product line lost customers.)
Predictive analytics: What will likely happen? (Next quarter's expected demand.)
Prescriptive analytics: What should we do about it? (The best price or stock level to choose.)
Traditional BI focuses on the first two levels. Predictive and prescriptive analytics look ahead.
What If You Could Have All Three In ONE Platform?
Infobrim brings business intelligence, predictive, prescriptive, and descriptive insights, and instant answers together in one place. Explore real-time dashboards and ask questions in English or Arabic, all from a single source of truth.
Request a free demo and see your data work as one.
Benefits of Business Intelligence for Your Business
Faster, fact-based decisions: Leaders see current numbers instead of waiting for monthly reports.
One source of truth: Every team works from the same data, which ends arguments over whose spreadsheet is right.
Higher operational efficiency: Bottlenecks and wasted spending become visible and fixable.
Better customer understanding: Buying patterns reveal what customers want and when.
Competitive advantage: Companies that spot trends early can act before rivals do.
Revenue growth: Clear insight into top products, channels, and customers shows where to invest.
Less manual reporting: Automated dashboards save analysts hours every week.
How AI and BI Work Together
When AI and BI work together, businesses see both sides of the story: what already happened and what is likely to happen next. BI explains the past and present, while AI adds forecasts and recommendations. The result is better-informed decisions and insights that were hard to reach before. Here are four ways the two complement each other.
Predictive Analytics
AI builds on the historical data that BI collects to forecast future trends. Businesses can spot market shifts, changes in customer behavior, and potential risks early, moving their decisions from reactive to proactive.
For example, a retail chain can predict which products will sell fastest during the next holiday season, then adjust its inventory and campaigns in advance.
Automated Insights
AI can scan huge datasets in seconds and surface patterns, anomalies, and trends that a human analyst might miss. Teams act faster and with more confidence. In finance, for instance, unusual transactions that may signal fraud are flagged right away, so the team can respond before losses grow.
Platforms like Infobrim take this a step further by letting anyone ask a question in plain English or Arabic and get an instant answer from their own live data.
Personalized Experiences
Combining AI and BI helps businesses tailor products, offers, and services to each customer's preferences. This raises satisfaction and loyalty, which matters most in customer-focused sectors such as retail and hospitality.
A streaming service, for example, suggests shows based on each viewer's history, keeping users engaged for longer.
Operational Efficiency
AI reviews the full picture that BI provides, finds where time and money are being lost, and suggests specific improvements. The outcome is smoother processes, lower costs, and higher productivity.
In manufacturing, for example, analyzing production data can reveal small adjustments that cut waste and raise output.
Advantages of Artificial Intelligence in Business Intelligence
Faster decisions: Insights arrive in seconds instead of days.
Higher productivity: Repetitive tasks such as data entry, sorting emails, and basic reporting run automatically.
Better accuracy: Fewer manual steps mean fewer human errors.
Personalized customer experiences: Recommendations and offers match each customer's behavior.
Lower costs: Automation and better forecasting reduce waste and overtime.
Round-the-clock service: Chat assistants answer common questions at any hour.
Stronger risk control: Fraud and security threats are spotted early.
Scalability: Systems handle growing data volumes without hiring at the same rate.
Case studies of Artificial Intelligence in Business Intelligence
Customer service chat assistants
Online stores and banks use chat assistants to answer common questions about orders, returns, and account balances. They handle simple requests instantly and pass complex cases to human agents with the full conversation attached. Customers get faster answers, and support teams spend their time on problems that need real judgment.
Product recommendations
Streaming platforms and online retailers study what each customer watches, clicks, and buys, then suggest items they are likely to enjoy. These suggestions keep users engaged longer and raise average order value, because shoppers discover products they would not have searched for on their own.
Fraud detection
Banks and payment companies monitor millions of transactions in real time. When a purchase does not match a customer's usual pattern, such as a large charge in a new country, the system flags or blocks it within seconds. This protects customers and cuts losses without slowing down normal payments.
Demand forecasting
Retailers and manufacturers combine sales history, seasonality, promotions, and even weather data to predict how much of each product they will sell. Accurate forecasts reduce both empty shelves and excess stock, which frees up cash and lowers storage costs.
Dynamic pricing
Airlines, hotels, and ride-sharing apps adjust prices based on demand, time, competitor rates, and availability. Prices rise when demand is high and fall to fill empty seats or rooms. Businesses earn more per sale while customers can still find lower prices at off-peak times.
Marketing personalization
Marketing teams use customer data to decide which message, offer, and channel will work best for each person. Emails go out at the time each subscriber usually opens them, and ads show products tied to past interest. The result is higher open rates and better return on ad spend.
Predictive maintenance
Factories and logistics companies place sensors on machines and vehicles. Software watches for small changes in heat, vibration, or sound that signal a coming failure. Teams repair equipment before it breaks, avoiding costly downtime and extending the life of expensive assets.
Hiring and HR screening
HR teams use software to sort applications, match skills to job requirements, and schedule interviews. It can also spot employees at risk of leaving by tracking engagement trends. Human reviewers should always make final decisions to keep the process fair.
Supply chain optimization
Logistics companies plan delivery routes that save fuel and time, while procurement teams spot supplier risks early. When a port delay or shortage appears, the system suggests alternative suppliers or routes, keeping goods moving.
Natural-language BI dashboards
Managers type plain questions like "Which store had the highest growth this month?" into their BI tool and get an instant chart. This brings data access to everyone in the company, not just analysts, and is one of the clearest ways AI and business intelligence now work side by side.
Business Intelligence Tools and Platforms
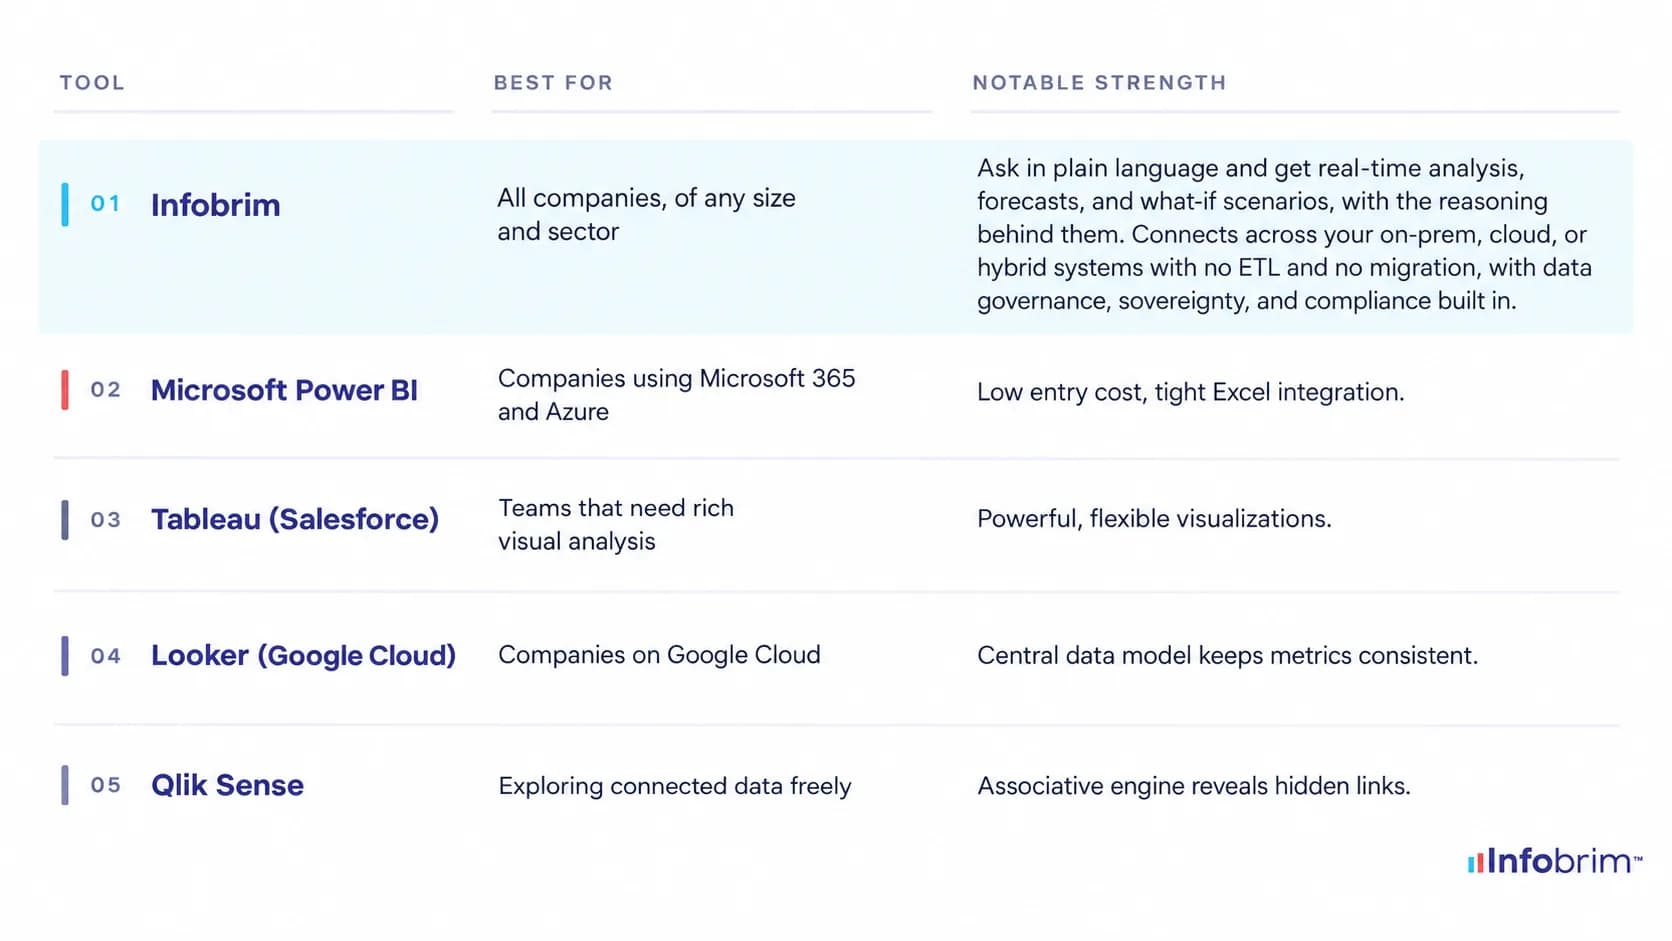
Choosing a BI tool usually means trading off budget, existing software, and team skills. Infobrim removes that trade-off: it suits every company and covers everything you need, from instant answers to forecasts, without moving your data.
Here is how it compares with other widely used options:
The Future of AI and BI in Business: The Rise of Data Platforms
In 2027, the line between business intelligence and artificial intelligence is fading, and businesses are moving from standalone BI tools to complete data platforms. A BI tool shows reports. A Data Platform connects every system, governs the data, and lets people analyze, forecast, and act from one place.
Four trends lead the way:
Data platforms replace single-purpose tools: Instead of separate tools for integration, reporting, and forecasting, companies choose one platform that covers the full data journey.
Agentic analytics: Software agents that not only report a problem but take approved actions, such as reordering stock when inventory runs low.
Natural-language dashboards: Conversation is becoming the main way people interact with data, replacing complex filters and menus.
Augmented analytics everywhere: Insights appear inside the apps people already use, such as email, chat, and CRM, instead of in a separate BI portal.
Infobrim reflects this shift. It is a data platform, not just a BI tool. It connects on-prem, cloud, and hybrid systems with no ETL and no migration, builds in data governance, sovereignty, and compliance, and lets anyone ask questions in plain language to get real-time analysis, forecasts, and what-if scenarios, with the reasoning behind them.
Request a free demo and see your data platform in action.
Frequently Asked Questions
What is business intelligence in simple terms?
Business intelligence is a way of turning company data into easy-to-read charts, reports, and dashboards. It shows what is happening in your business so you can make better decisions.
What's the difference between business intelligence and business analytics?
Business intelligence mainly explains what happened and why, using past and current data. Business analytics is broader and also includes predicting future outcomes and recommending actions.
What is the difference between BI and AI?
BI describes and visualizes data so people can make decisions. AI learns from data to predict outcomes and can make or automate decisions itself. Many modern BI tools now include AI features.
What are examples of business intelligence tools?
Popular BI tools include Microsoft Power BI, Tableau, Looker, Qlik Sense, Zoho Analytics, and Sigma Computing.
Is AI part of business intelligence?
AI is not required for BI, but it is now a common part of it. Features such as natural-language search, automated insights, and anomaly detection bring AI directly into BI platforms.
How is AI used in business today?
Companies use AI for customer service chat, product recommendations, fraud detection, demand forecasting, dynamic pricing, marketing personalization, and predictive maintenance, among many other tasks.